
Jerusalem Survey Results
The data was collected between late 2018-2019 and comprised of 240 Households around the Jerusalem Clinic. The results are Rush IRB reviewed and approved.
Poverty Index + Hunger
Over 90% of households earn an average income equivalent to between $9-$90/month. 60% of community members report someone in the household has gone to bed hungry or gone a whole day without eating anything.
AVERAGE MONTHLY INCOME FOR ENTIRE HOUSEHOLD
1,000 Haitian Gourde (HTG) = $9 United States Dollar (USD)

COMMUNITY MEMBERS THAT HAVE GONE A DAY WITHOUT A MEAL OR GO TO SLEEP HUNGRY

Sanitation + Water
The majority of community members live in homes made of some sort of combination of concrete (54%), wood (24%), metal (22%) and/or tent housing (19%). Water is sourced through rain, pumps, and for purchase, and most often purified, reported by 90% of households. 22% of households report no access to a latrine. Those with access to a latrine share it with at least one other family, with 17% reporting it shared by 3-4 families, and 26% reporting it shared by 5 or more.
TYPES OF HOUSING CURRENTLY

LATRINE AVAILABILITY

NUMBER OF FAMILIES WHO SHARE THE LATRINE

Reproductive Health
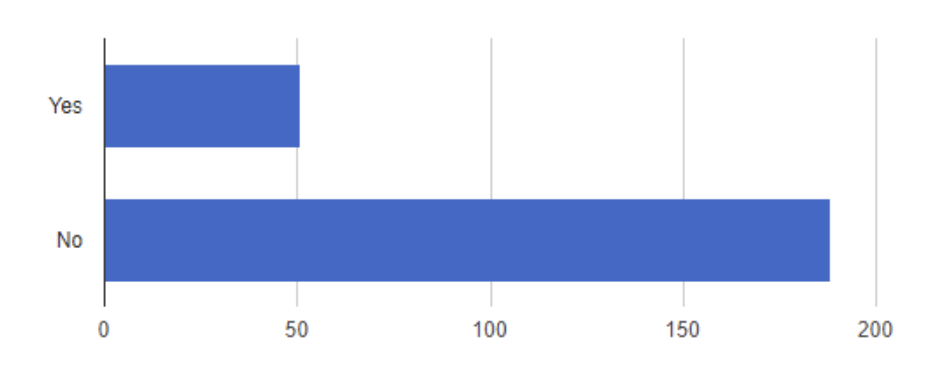
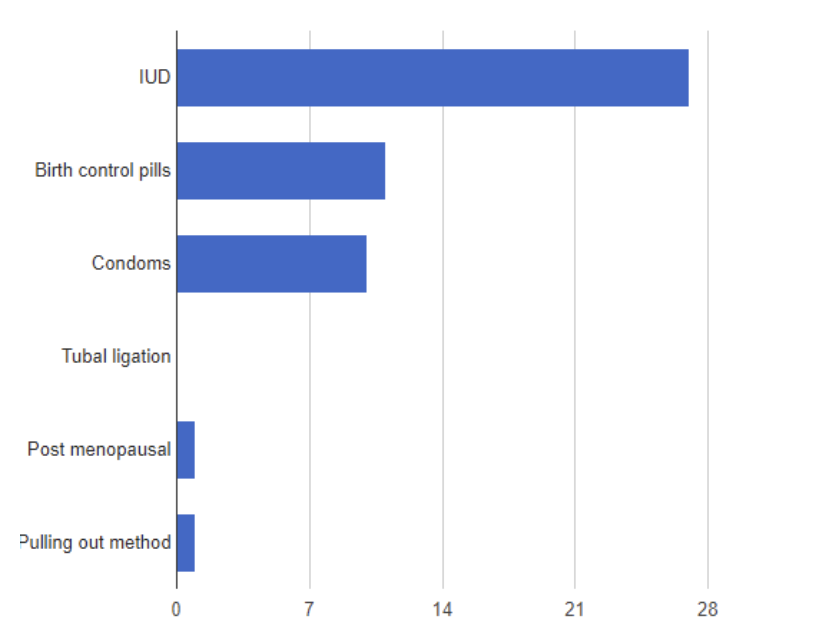
19% of households report no access to condoms if needed, while 54% don’t know if condoms are available. 11% of households report males in the household use condoms sometimes, 9% report rarely, 39% report never, and 32% report it is dependent on sexual partner. 21% of households report using birth control, with the most common methods being IUD, birth control pills, and condoms. Of the 79% not using birth control, reasons cited include: not important (75%), not affordable (2%), not available (2%), and not allowed (22%).
ARE CONDOMS AVAILABLE IF NEEDED?

TYPES OF BIRTH CONTROL USED

CURRENT BIRTH CONTROL USE
REASONS CITED FOR NOT USING BIRTH CONTROL

Maternal Child Health
71% of household report having raised infants in the home, with the majority (94%) of them having been breastfed. 25% of households report not having taken prenatal vitamins before or during pregnancy, of those reason cited include: not knowing it was important (83%), not available (11), and not affordable (6%). 31% of households report wanting to have more children and 79% report not wanting to have more children. Most households report their last child was delivered in a hospital (58%), although 27% report having delivered in the home and less than 1% reports in a clinic.
PRENATAL VITAMIN USE DURING LAST PREGNANCY

WHERE WAS THE LAST CHILD DELIVERED?

HOUSEHOLDS WANTING MORE CHILDREN

Communicable + Non-Communicable Disease
10% of households report not being seen by a provider within the last 12 months. 43% of households report blood pressure problems, 8% report diabetes, 5% report asthma, 4% report depression, and ≤ 4% report sickle cell disease, heart disease, kidney disease, cholera, malaria, TB, and HIV. 45% of household report a family history of high blood pressure and 15% report a family history of diabetes.
With regard to HIV knowledge, households report they believe HIV is spread through blood (91.3%), sexual contact (84.2%), touching (3.3%), kissing (49.6%), sharing items with HIV positive person (5.4%), looking at someone who is HIV positive (0.8%), and don't know (3.3%). 69% of households report using mosquito nets at some point during the year.
PROVIDEER VISITS OVER THE LAST 12 MONTHS

HOUSEHOLD REPORTING HEALTH PROBLEMS

Areas of Opportunity and Next Steps
Poverty Index + Hunger:
Improve food insecurity
Limitations of study: did not include barter and trade as a form of income
Sanitation + Water:
Assess access to soap/water and hand-sanitizer
Increase access to potable water
Maternal Child Health:
Further assess Depo-provera and IUD use
Increase access to birth control (specifically Depo and LARCs)
Increase access to prenatal vitamins
Education:
Prenatal
Pregnancy Prevention
STI Prevention
HIV
Poverty Index + Hunger
Average Monthly Income for Entire Household Less than 1,000 HTG (96, 40.0%), 1000-2,000 HTG (54, 22.5%), 2000-5,000 HTG (45, 18.8%), 5000-10,000 HTG (30, 12.5%), More than 10,000 HTG (15, 6.3%)
1,000 Haitian Gourde (HTG) = $9 United States Dollar (USD)

Has anyone in the household ever gone to sleep hungry or gone a whole day without eating anything?
Yes (144, 60.5%), No (94, 39.5%)

Sanitation + Water
Types of housing currently?
Tent housing (45, 18.7%), Metal (52, 21.6%), Mud (0, 0.0%), Wood (58, 24.1%), Plastic (1, 0.4%), Concrete (130, 53.9%)

How does the household obtain water?
Rain water (124, 51.5%), Buy water (227, 94.2%), Pump (31, 12.9%)

Is a latrine available for the household to use? Yes (188, 78.0%), No (53, 22.0%)

Does someone in the household purify or filter the water?
Yes (215, 90.3%), No (23, 9.7%)

If so, how far away is the latrine?
Less than 5 minute walk (174, 93.0%), 5-10 minutes (11, 5.9%), More than 10 minutes walk (2, 1.1%)

How many families share the latrine?
None (0, 0.0%), 1-2 (107, 57.5%), 3-4 (31, 16.7%), 5 or more (48, 25.8%)

In a day, how many times after using the latrine do the members wash their hands with soap and water?
Always wash (100% of the time) (199, 93.9%), Almost always wash (75%) (12, 5.7%), Sometimes wash (50%) (1, 0.5%), Rarely Wash (25%) (0, 0.0%), Never wash (0%) (0, 0.0%)

Reproductive Health
On average, how often are condoms used by the males in the household?
Always (100%) (17, 7.2%), Almost Always (75%) (4, 1.7%), Sometimes (50%) (27, 11.4%), Rarely (25%) (21, 8.9%), Never (0%) (92, 39.0%), Dependent on sexual partner (75, 31.8%)

Are condoms available in the community for members of household if needed?
Yes (65, 27.3%), No (45, 18.9%), Don't know (128, 53.8%)

Are you currently using birth control?
Yes (51, 21.3%), No (188, 78.7%)

If yes, what kind of method are you using?
IUD (27, 54.0%), Birth control pills (11, 22.0%), Condoms (10, 20.0%), Tubal ligation (0, 0.0%), Post menopausal (1, 2.0%), Pulling out method (1, 2.0%)
If you are not using birth control, why not?
Not important (139, 75.1%), Not affordable (3, 1.6%), Not available (3, 1.6%), Not allowed (40, 21.6%)

Maternal Child Health
If so, were any of them breastfed?
Yes, and for more than 6 months of age (135, 81.3%), Yes, but for less than 6 months of age (6, 3.6%), Yes, but all were breastfed for variable amounts of time (15, 9.0%), No (10, 6.0%)
Are there currently or were infants raised in this house ever?
Yes (168, 71.2%), No (68, 28.8%)


Did you or another women in the household take prenatal vitamins during the last pregnancy?
Yes (178, 75.4%), No (58, 24.6%)
If not, what was the reason?
Did not know it was important (44, 83.0%), Not available (6, 11.3%), Not affordable (3, 5.7%)


Where was the last child delivered?
Clinic (1, 0.4%), Hospital (139, 58.4%), Home (65, 27.3%), No children have been delivered in this household (33, 13.9%)
Would you or others in the household want to have more children?
Yes (75, 31.4%), No (164, 68.6%)


Communicable + Non-Communicable Disease
In the past 12 months has a doctor or health professional told anyone in the household that they have: Select all that apply.
Heart attack (2, 0.8%), Heart disease (9, 3.8%), Kidney disease (5, 2.1%), Stroke (7, 2.9%), Bood pressure problems (103, 42.9%), Sickle cell anemia (10, 4.2%), Asthma (12, 5.0%), Cholera (7, 2.9%), Malaria (10, 4.2%), Diabetes (20, 8.3%), Tuberculosis (1, 0.4%), HIV/AIDs (1, 0.4%), Depression (9, 3.8%), None of the above (101, 42.1%)
In the past 12 months has anyone in the household been to: Select all that apply.
Community health clinic, that was not Jerusalem Clinique (50, 20.9%), Jerusalem Clinique (103, 43.1%), Community clinic for mental health (2, 0.8%), Hospital outpatient clinic (72, 30.1%), Emergency room (13, 5.4%), Private doctor office (21, 8.8%), Traditional Healer/ Houngan (4, 1.7%), None of the above (24, 10.0%)


Is there a history of sugar problems, diabetes, in the family (for example grandparents or other relatives)?
Yes (36, 14.9%), No (184, 76.3%), Don't know (21, 8.7%)
Is there a history of blood pressure problems in the family (for example grandparents or other relatives)?
Yes (109, 45.4%), No (116, 48.3%), Don't know (15, 6.3%)


Who is at highest risk of getting HIV? Select all that you feel are correct.
Babies with HIV+ mothers (200, 84.7%), Men who have sex with men (143, 60.6%), Sex workers (159, 67.4%), People who use IV drugs (131, 55.5%), Having sex with HIV+ opposite sex partner and using condom (9, 3.8%), Everybody is at risk (170, 72.0%), Having sex with HIV + opposite sex partner and not using condom (180, 76.3%)
How do the members of the household think HIV is spread? Select all that you feel are correct.
Blood (219, 91.3%), Sexual contact (202, 84.2%), Touching (8, 3.3%), Kissing (119, 49.6%), Sharing items with HIV positive person (13, 5.4%), Looking at someone who is HIV positive (2, 0.8%), Don't know (8, 3.3%)


Does the household use mosquito nets at any point during the year?
Yes (166, 69.2%), No (74, 30.8%)
